The Anatomy of a Great Dashboard: Layout Tips from Real Teams

Design isn’t just cosmetic—your dashboard layout directly impacts the decisions your team makes. Learn about how top performing teams optimize their dashboards!
Share article
Share this article on your favorite social platform!

The Anatomy of a Great Dashboard: Layout Tips from Real Teams

Design isn’t just cosmetic—your dashboard layout directly impacts the decisions your team makes. Learn about how top performing teams optimize their dashboards!

Why Dashboard Design Matters

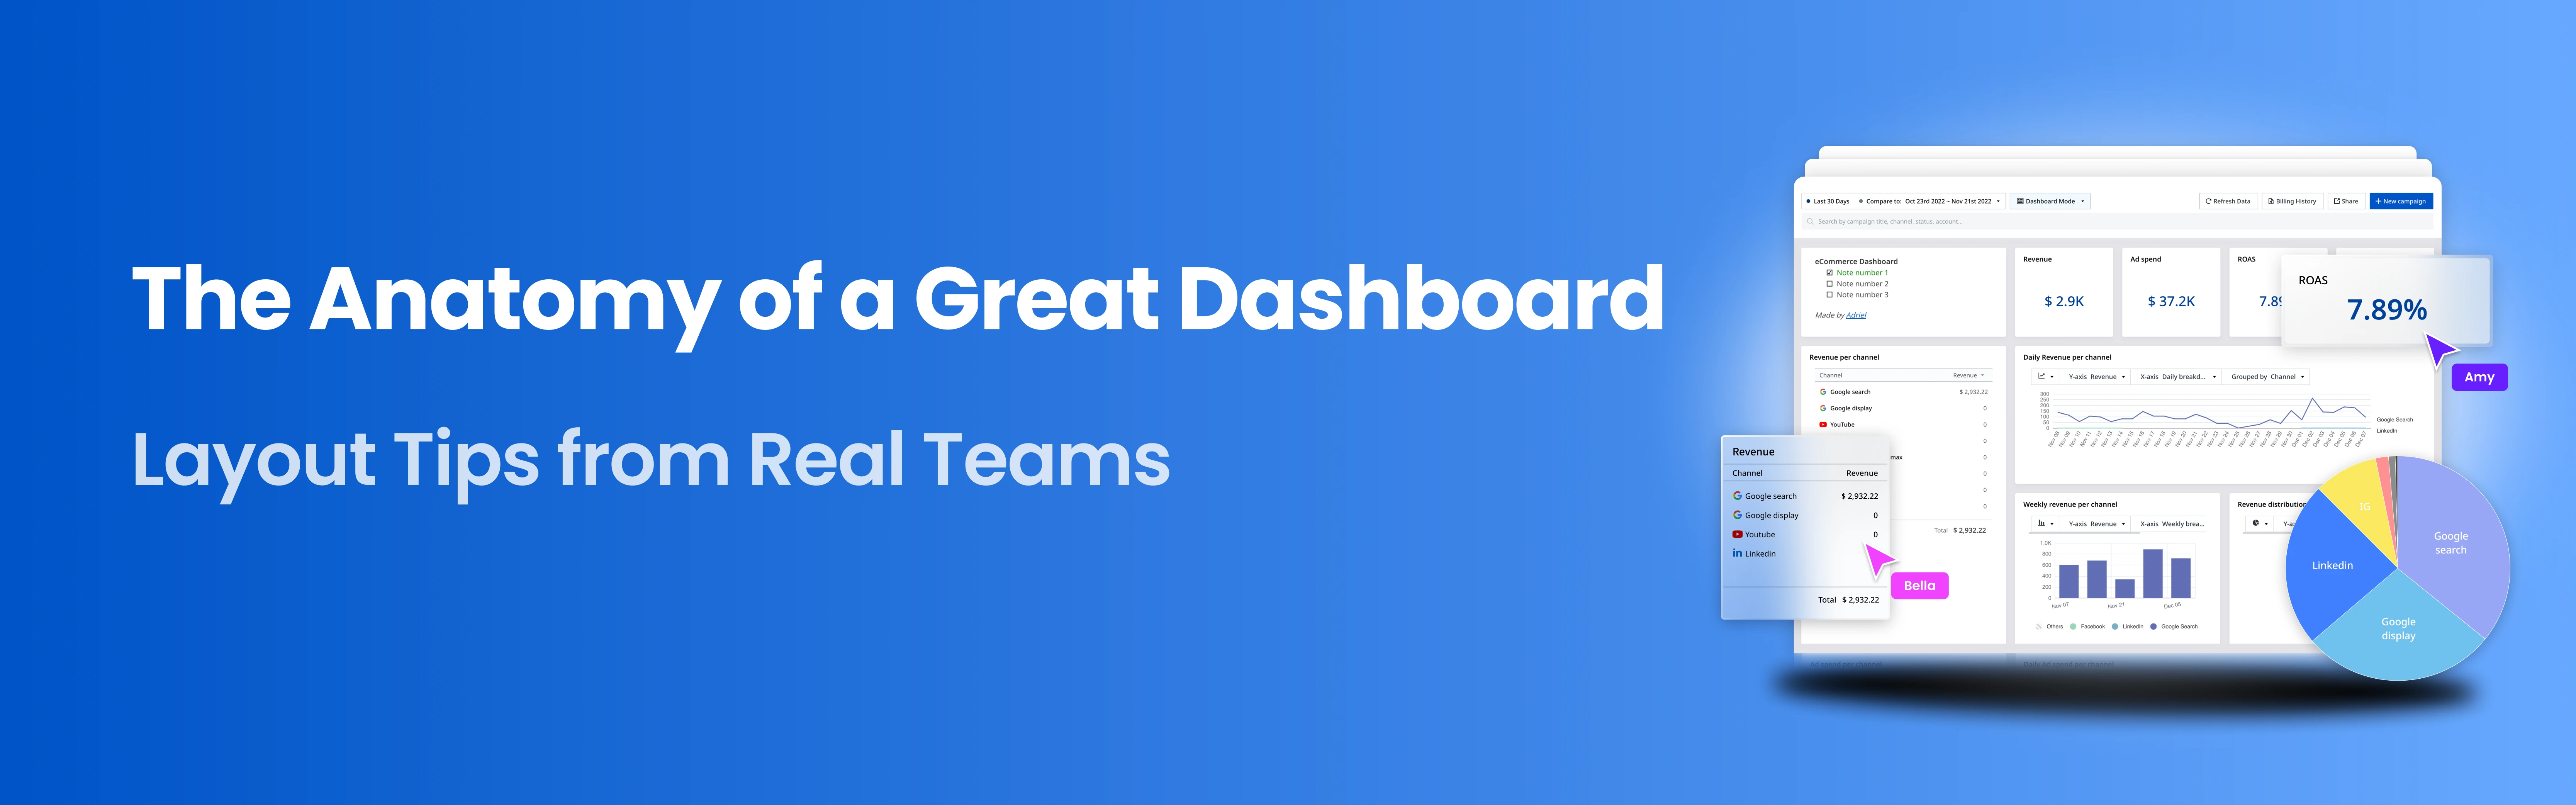
A dashboard isn’t just a collection of charts, it’s your team’s decision-making nerve center. When designed well, it can:

  • Provide a clear snapshot of performance at a glance
  • Highlight actionable insights (not just vanity metrics)
  • Align marketing, sales, and leadership around the same KPIs

But most dashboards fail because they’re cluttered, disconnected, or designed without a clear purpose.

To understand what makes a dashboard great, we’ve looked at real teams using Adriel and identified five design principles that consistently work.

1. Start with the Question, Not the Data

A dashboard is only as valuable as the questions it answers.
Before adding widgets and charts, ask:

  • “What decisions should this dashboard help us make?”
  • “Which KPIs actually move the needle for our goals?”

For example:

  • A C-level dashboard should focus on ROI, CAC, and pipeline metrics.
  • A performance marketer dashboard might prioritize CPC, ROAS, and creative performance.

Adriel’s Tip: Less is more. 5–7 key metrics per view is ideal.

2. Group Metrics by Funnel Stage or Objective

Real teams find it easier to navigate dashboards when metrics are grouped by logical sections, such as:

  • Top-of-funnel (awareness): Impressions, CPM, reach
  • Mid-funnel (engagement): CTR, landing page conversion rate
  • Bottom-of-funnel (revenue): Cost per acquisition, ROAS, pipeline value

Adriel’s Tip: Create a “Campaign Overview” section at the top (spend, impressions, clicks) and then drill down into conversions and ROI in the second row.

3. Use Visual Hierarchy to Drive Focus

Not all KPIs are created equal. Your dashboard should emphasize the metrics that matter most:

  • Use larger widgets or bold colors for top KPIs.
  • Place your “must-watch” metrics at the top-left (the natural reading point).
  • Use sparing color coding to highlight positive vs. negative trends.

A cluttered dashboard with equal-sized charts is a decision-making nightmare.

4. Combine Cross-Channel Data in One View

Real-world marketing teams need a single source of truth, not five tabs for Google Ads, Meta Ads, LinkedIn, and TikTok.

With Adriel, teams can:

  • See all ad spend and performance by channel in one panel
  • Compare ROAS across channels without switching platforms
  • Blend ad data with CRM outcomes for a complete picture

Adriel’s Tip: Always tie spend data to outcomes. A dashboard that stops at CTR or CPC isn’t telling the full story.

5. Make Dashboards Interactive (Not Static)

The best dashboards aren’t one-size-fits-all — they allow users to filter, segment, and drill down into data.

Real teams use interactive features to:

  • Filter by campaign, region, or audience
  • Compare this week vs. last week performance
  • Toggle between ad platforms for deeper insights

Adriel’s dashboards allow teams to move from big-picture KPIs to granular views in seconds, without exporting data.

Bonus Tip: Leverage AI for Instant Insights

In 2025, teams aren’t just looking at dashboards — they’re asking them questions.

With Adriel’s AI Agent, you can get deep insights in just seconds!

  • Ask: “Which campaign had the highest conversion % last week?”
  • Get instant, data-backed answers — no manual analysis required.

This takes dashboarding beyond visualization and into actionable intelligence.

Final Thoughts

A great dashboard is more than pretty charts. It’s a strategic tool that helps teams:

  • Align on priorities
  • Make faster, better decisions
  • Connect marketing activity to actual ROI

The teams getting this right aren’t building dashboards manually every week — they’re using tools like Adriel to automate the heavy lifting, customize layouts, and surface insights in real time.

Ready to build a dashboard your team actually uses? Speak with one of our experts and begin your free trial today!

Share article
Share this article on your favorite social platform!
Subscribe to Adriel
Newsletter!
Stay ahead with industry trends, insight and Adriel update:
Deliverd straight to your inbox.
Take Control of Your Marketing Data Today
The Definitive Guide to AdOps
How to power the next wave of digital marketing
Download for Free

Step up your marketing game!

Subscribe to our newsletter to get marketing tips, guides, and updates delivered straight to your inbox.
You're all set! Thanks for subscribing.
Oops! Something went wrong while submitting the form.
Your privacy is safe with us. Here’s our privacy policy.
Pas si vite !
Pourquoi pas une Démo ?
Nous vous aiderons à optimiser vos processus d'opérations marketing et à économiser des milliers de dollars chaque mois sur les tâches manuelles.
Merci !
Vous allez être redirigé prochainement.
Oups ! Une erreur s'est produite lors de l'envoi du formulaire.